

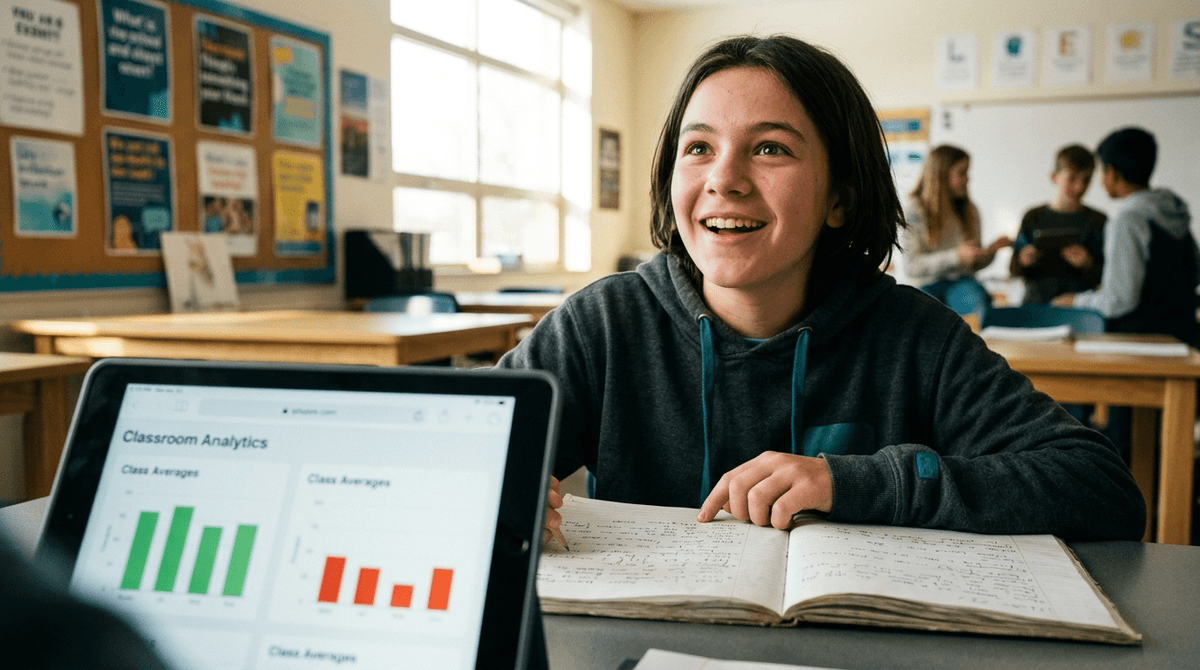

Automated learning dashboards at your child's school are built to track class-wide trends, which means they routinely miss the quiet breakthroughs and unique struggles that make your kid an individual.
Automated data-tracking tools in classrooms flatten individual student progress by prioritizing common keywords over rare, meaningful breakthroughs.
Schools are increasingly adopting automated dashboards to track student journaling, reading comprehension, and writing progress. When teachers rely on visual summaries of class data, quiet kids who express ideas in unique ways or students making subtle, non-standard breakthroughs risk being invisible to the algorithm.
Software metrics often measure frequency rather than depth. If an automated tool summaries your child's work, it measures how often they use expected words, not how deeply they understood the assignment.
EdTech companies are pushing algorithms that turn written student work into word-frequency graphs to save teachers time. Researchers wanted to know whether these automated visual summaries actually help educators understand how kids learn, or if counting words distorts reality.
Automated text-analysis tools create a heavy "bias toward the average" that buries individual student growth.
- Trend spotting is fast: Experts agreed that word-frequency charts give a quick snapshot of what a large group of kids is discussing on average.
- Breakthroughs get buried: Rare but crucial student epiphanies don't happen frequently enough to make it onto word-count charts, making those moments invisible in automated summaries.
- Speed replaces depth: Visual analytics tools push educators toward quantitative speed at the direct expense of qualitative understanding of individual student struggles.
Software designed to make grading faster inherently treats outlier ideas as noise rather than signal. If an algorithm summarizes your child's journal entries or essay responses, it rewards repetitive, predictable vocabulary while ignoring creative, non-traditional expressions of learning.
This evaluation relied on a tiny sample of ten academic researchers rather than time-strapped K-12 classroom teachers who might use software differently. Furthermore, the findings come from a preprint paper that has not yet completed formal peer review.
- If your child's school relies heavily on automated dashboard grades... Ask the teacher how they evaluate unique or non-standard written responses that word-count algorithms might overlook.
- If your child reports that an online journal or reading tool gave them low engagement scores... Review the actual written responses together to check if creative phrasing was missed by a frequency-based filter.
- If you are reviewing an automated progress report from a digital learning platform... Treat word counts and automated topic scores as a high-level class summary rather than an accurate picture of your child's personal progress.
Do not panic if an automated school dashboard shows your child lagging behind on topic keywords or class trends. Data-visualization tools are built for speed and pattern-matching, not for recognizing the quiet, unique leaps in your child's personal learning journey.
Huyen N. Nguyen, Kathleen Bowe, Minh-Huyen Nguyen et al. (2026). Through the WordStream Glass: Revisiting Quantitative Encoding for Qualitative Learning Analytics. arXiv (preprint). — arxiv.org